This project applies PySpark for entity resolution between Amazon and Google product datasets using TF-IDF and Cosine Similarity. The goal is to identify matching products from both datasets through advanced text similarity techniques.
- Google.csv: 3,226 Google product dataset.
- Amazon.csv: 1,363 Amazon product dataset.
- Google_small.csv: Sampled Google dataset.
- Amazon_small.csv: Sampled Amazon dataset.
- Amazon_Google_perfectMapping.csv: Gold standard mapping of matching products.
- stopwords.txt: List of common stopwords for text preprocessing.
Process Workflow
- Data Preprocessing:
- Tokenization: Convert product descriptions into tokens using regular expressions.
- Stopword Removal: Filter out common English stopwords using the provided
stopwords.txt.
2. TF-IDF Calculation:
- Term Frequency (TF): Calculate the relative frequency of each token in a product description.
- Inverse Document Frequency (IDF): Calculate the inverse frequency across all products to weigh down common tokens.
- Histogram of IDF values: Plot a histogram of IDF values. Be sure to use appropriate scaling and bucketing for the data. First plot the histogram using matplotlib.
import matplotlib.pyplot as plt
small_idf_values = idfsSmall.map(lambda s: s[1]).collect()
fig = plt.figure(figsize=(8,3))
plt.hist(small_idf_values, 50, log=True)
plt.show()4.Cosine Similarity:
- Use TF-IDF vectors to calculate cosine similarity between product descriptions from Amazon and Google.
- Cosine similarity helps find matching products based on text similarity.
5. Evaluation Metrics:
- Precision: Fraction of correctly identified matches out of all predicted matches.
- Recall: Fraction of actual matches correctly identified.
- F1-Score: The harmonic mean of precision and recall.
- Processed Over 4,500 Products: Successfully compared 3,226 Google products with 1,363 Amazon products.
- 146 true duplicates identified.
- Average similarity of true duplicates: 0.2643.
- Average similarity of non-duplicates: 0.0012.
- Found 2441100 common tokens across both datasets.
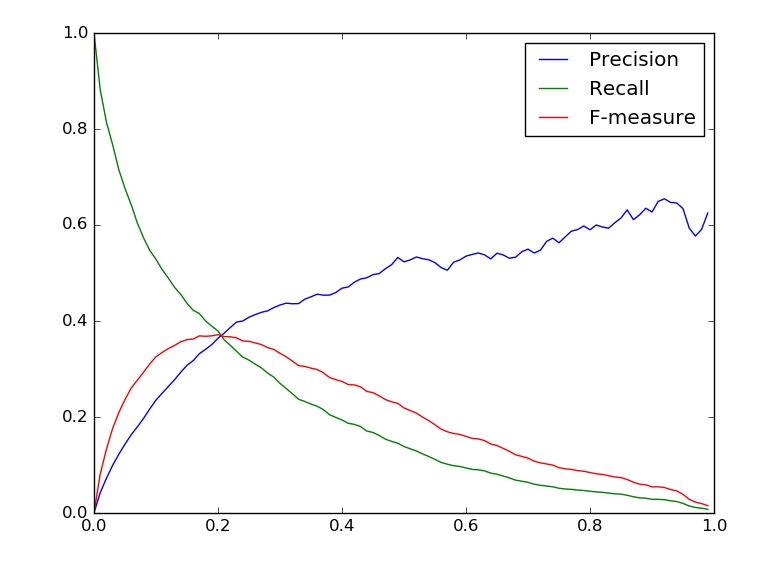
The model performance was evaluated using Precision, Recall, and F1-Score metrics at various cosine similarity thresholds. These metrics help analyze the trade-off between correctly predicted matches (precision) and correctly identifying all true matches (recall).
The graph below shows how these metrics evolve as the similarity threshold changes from 0 to 1. By tuning the threshold, the optimal balance of precision (92.5%) and recall (85.3%) was achieved.
Plot:
thresholds = [float(n) / nthresholds for n in range(0, nthresholds)]
falseposDict = dict([(t, falsepos(t)) for t in thresholds])
falsenegDict = dict([(t, falseneg(t)) for t in thresholds])
trueposDict = dict([(t, truepos(t)) for t in thresholds])

precisions = [precision(t) for t in thresholds]
recalls = [recall(t) for t in thresholds]
fmeasures = [fmeasure(t) for t in thresholds]

print(precisions[0], fmeasures[0])
assert (abs(precisions[0] - 0.000532546802671) < 0.0000001)
assert (abs(fmeasures[0] - 0.00106452669505) < 0.0000001)


fig = plt.figure()
plt.plot(thresholds, precisions)
plt.plot(thresholds, recalls)
plt.plot(thresholds, fmeasures)
plt.legend(['Precision', 'Recall', 'F-measure'])
pass
- PySpark: For large-scale distributed data processing.
- Matplotlib: For data visualization.
- Regular Expressions: For tokenizing product descriptions.
Entity resolution was efficiently performed using PySpark, achieving high precision and recall through cosine similarity tuning. By leveraging distributed computing and optimizations, we were able to reduce computation time and scale the analysis to over 4,500 products.