daysWithAvg = avgDailyReqPerHost.map(lambda day_req: day_req[0]).collect()
avgs = avgDailyReqPerHost.map(lambda day_req: day_req[1]).collect()

# TEST Visualizing unique daily hosts (3d)
test_days = list(range(1, 23))
test_days.remove(2)
Test.assertEquals(daysWithHosts, test_days, 'incorrect days')
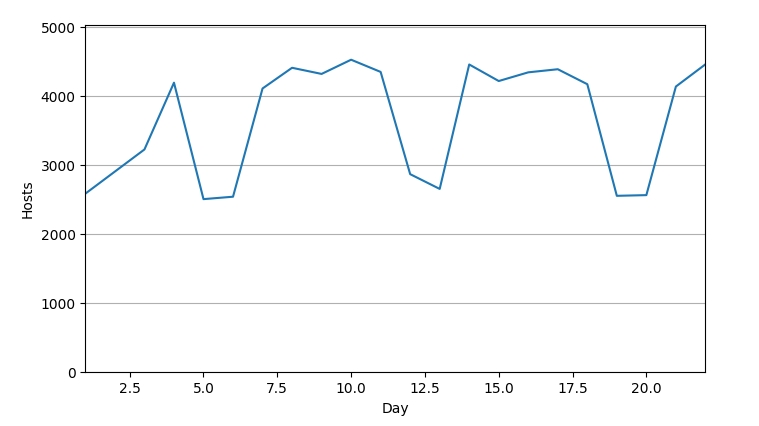
Test.assertEquals(hosts, [2582, 3222, 4190, 2502, 2537, 4106, 4406, 4317, 4523, 4346, 2864, 2650, 4454, 4214, 4340, 4385, 4168, 2550, 2560, 4134, 4456], 'incorrect hosts')

fig = plt.figure(figsize=(8,4.5), facecolor='white', edgecolor='white')
plt.axis([min(daysWithHosts), max(daysWithHosts), 0, max(hosts)+500])
plt.grid(visible=True, which='major', axis='y')
plt.xlabel('Day')
plt.ylabel('Hosts')
plt.plot(daysWithHosts, hosts)
passThis project involves analyzing web server log data using Apache Spark to extract meaningful insights from a large dataset. By processing over 1 million log entries, this project identifies important traffic patterns, tracks errors, and monitors server performance.
The dataset used is an Apache Web Server log file in the Common Log Format (CLF). It consists of over 1 million log entries from the NASA Kennedy Space Center server. Each log entry provides detailed information about web requests, including timestamps, IP addresses, HTTP methods, response codes, and content sizes.
- Log Parsing: Corrected initial errors in parsing using refined regular expressions, successfully processing over 99.99% of log entries.
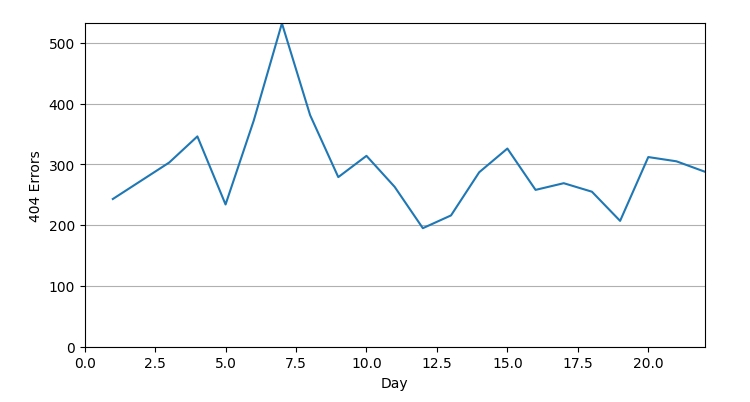
- Error Analysis: Analyzed 404 (Not Found) error patterns by day, hour, and specific URLs.
- Traffic Monitoring: Generated insights into traffic distribution across days, hours, and by specific endpoints.
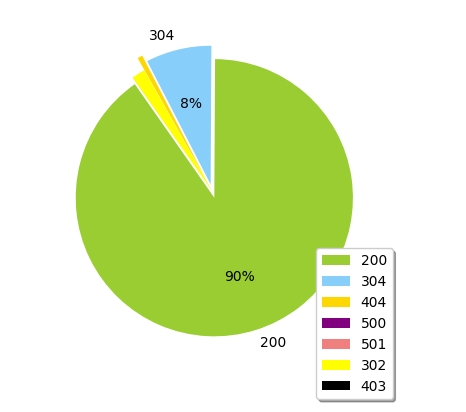
- Visualization: Used Matplotlib to visualize trends, including hourly 404 errors, response codes, and traffic patterns.
- Set Up Environment: Ensure Java 8 is installed for PySpark to function properly. Run the following command in your environment:
!apt install openjdk-8-jdk-headless -qq2. Install PySpark: Install the required PySpark package.
!pip install pyspark3. Download the Dataset: Download the NASA web server log dataset from this link.
4. Run the Analysis: Load the dataset and run the provided Spark scripts to perform log parsing, error tracking, and traffic analysis.
📈 Results
- Log Parsing Success Rate: 99.99% of logs were successfully parsed after regular expression refinement.
- Top 404 Errors: Identified the top 20 URLs responsible for 404 errors, revealing common broken links.
- Traffic Insights: Analyzed traffic patterns and identified peak activity hours and days.
Developed a web server log analysis system using PySpark to process and analyze Apache server logs.
- Corrected 108 parsing errors in the initial dataset by refining regular expressions, achieving a 99.99% log parsing success rate.
- Conducted analysis of over 1 million log entries, producing insights such as top endpoints, response codes, and traffic patterns by day and hour.
- Visualized key metrics like the top error-prone endpoints and 404 response code trends using Matplotlib, enhancing the ability to monitor server performance and detect issues.
📊 Visualization
Key metrics are visualized using Matplotlib, showcasing trends like:
Top 404 Error URLs
This bar chart displays the top 20 URLs that caused the most 404 errors.
# Top 20 404 Error URLs Data
urls, counts = zip(*badEndpointsTop20)

# Bar Chart Visualization
fig = plt.figure(figsize=(10,6), facecolor='white', edgecolor='white')
plt.barh(urls, counts, color='skyblue')
plt.xlabel('Number of 404 Errors')
plt.ylabel('URL')
plt.title('Top 20 URLs Causing 404 Errors')
plt.tight_layout()
plt.show()
# Hourly 404 Errors Data
hoursWithErrors404 = hourRecordsSorted.map(lambda a: a[0]).collect()
errors404ByHours = hourRecordsSorted.map(lambda a: a[1]).collect()

# Line Graph Visualization
fig = plt.figure(figsize=(8,4.2), facecolor='white', edgecolor='white')
plt.axis([0, max(hoursWithErrors404), 0, max(errors404ByHours)])
plt.grid(visible=True, which='major', axis='y')
plt.xlabel('Hour of Day')
plt.ylabel('Number of 404 Errors')
plt.plot(hoursWithErrors404, errors404ByHours)
plt.title('Hourly Distribution of 404 Errors')
plt.show()daysWithHosts = dailyHosts.map(lambda day_host: day_host[0]).collect()
hosts = dailyHosts.map(lambda day_host: day_host[1]).collect()
# Line Graph Visualization
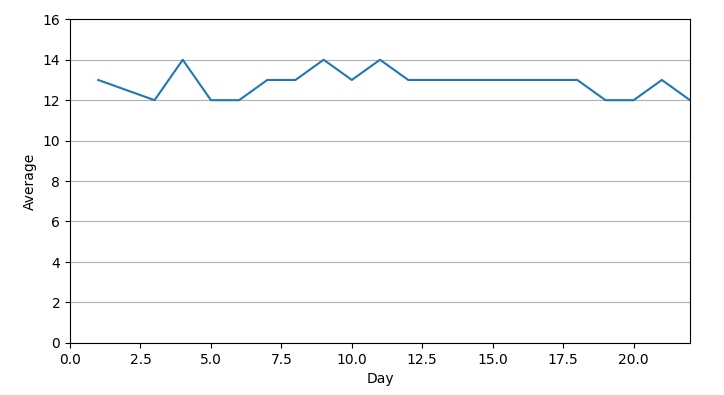
fig = plt.figure(figsize=(8,4.2), facecolor='white', edgecolor='white')
plt.axis([0, max(daysWithAvg), 0, max(avgs)+2])
plt.grid(visible=True, which='major', axis='y')
plt.xlabel('Day')
plt.ylabel('Average')
plt.plot(daysWithAvg, avgs)
pass
daysWithAvg = avgDailyReqPerHost.map(lambda day_req: day_req[0]).collect()
avgs = avgDailyReqPerHost.map(lambda day_req: day_req[1]).collect()

# TEST Visualizing unique daily hosts (3d)
test_days = list(range(1, 23))
test_days.remove(2)
Test.assertEquals(daysWithHosts, test_days, 'incorrect days')
Test.assertEquals(hosts, [2582, 3222, 4190, 2502, 2537, 4106, 4406, 4317, 4523, 4346, 2864, 2650, 4454, 4214, 4340, 4385, 4168, 2550, 2560, 4134, 4456], 'incorrect hosts')

fig = plt.figure(figsize=(8,4.5), facecolor='white', edgecolor='white')
plt.axis([min(daysWithHosts), max(daysWithHosts), 0, max(hosts)+500])
plt.grid(visible=True, which='major', axis='y')
plt.xlabel('Day')
plt.ylabel('Hosts')
plt.plot(daysWithHosts, hosts)
pass
daysWithAvg = avgDailyReqPerHost.map(lambda day_req: day_req[0]).collect()
avgs = avgDailyReqPerHost.map(lambda day_req: day_req[1]).collect()

# TEST Visualizing unique daily hosts (3d)
test_days = list(range(1, 23))
test_days.remove(2)
Test.assertEquals(daysWithHosts, test_days, 'incorrect days')
Test.assertEquals(hosts, [2582, 3222, 4190, 2502, 2537, 4106, 4406, 4317, 4523, 4346, 2864, 2650, 4454, 4214, 4340, 4385, 4168, 2550, 2560, 4134, 4456], 'incorrect hosts')

fig = plt.figure(figsize=(8,4.5), facecolor='white', edgecolor='white')
plt.axis([min(daysWithHosts), max(daysWithHosts), 0, max(hosts)+500])
plt.grid(visible=True, which='major', axis='y')
plt.xlabel('Day')
plt.ylabel('Hosts')
plt.plot(daysWithHosts, hosts)
pass