Using the Ames Housing Dataset
This project uses the K-Nearest Neighbors (KNN) algorithm to predict home prices in Ames, Iowa based on historical data from Kaggle’s Ames Housing Dataset. We aim to predict a target house’s price based on the similarity to other houses.
📊 DatasetSource:
- Kaggle’s Ames Housing Dataset
- Size: 2,919 observations and 79 features
- Features: Information about house size, quality, area, age, and other attributes related to housing prices in Ames, Iowa.
🔄 Project Overview
This project involves the following steps:
1. Data Preprocessing:
- Loaded the dataset as a Pandas DataFrame.
- Cleaned and handled missing values.
- Performed exploratory data analysis to understand key features.
2. Key Feature Analysis:
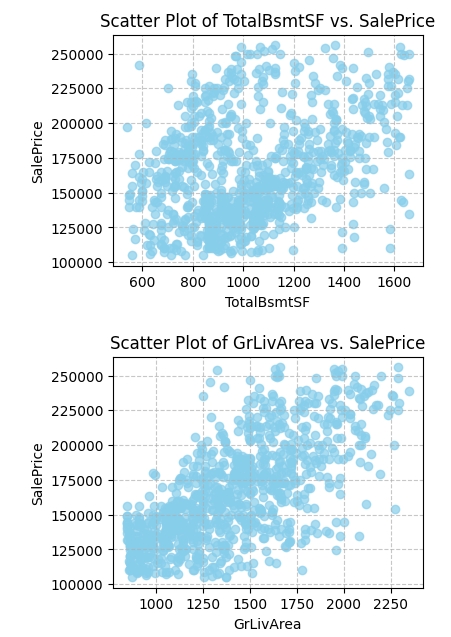
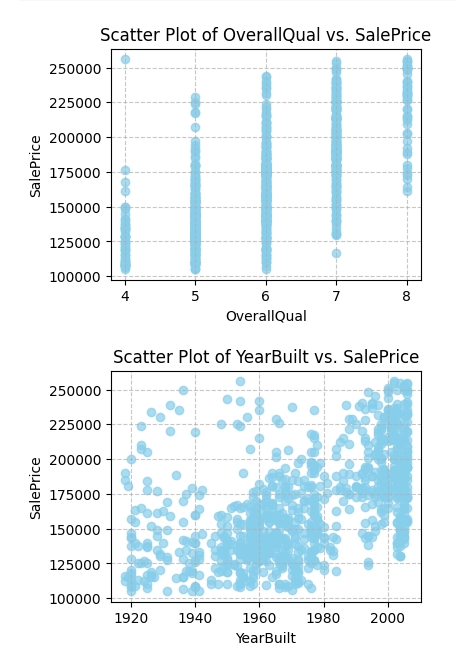
- Analyzed the relationship between important features like OverallQual, YearBuilt, TotalBsmtSF, GrLivArea, and SalePrice.
- Performed correlation analysis and generated descriptive statistics.
📊 Visualization
Correct Formatting for Histograms of Key Features:
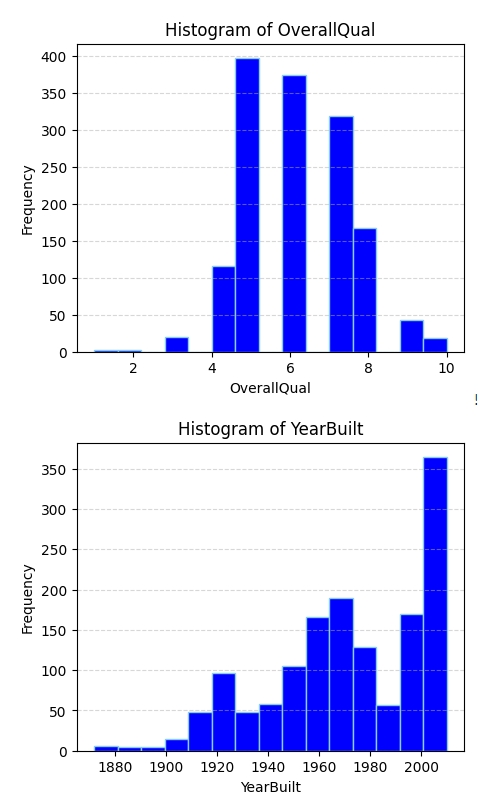
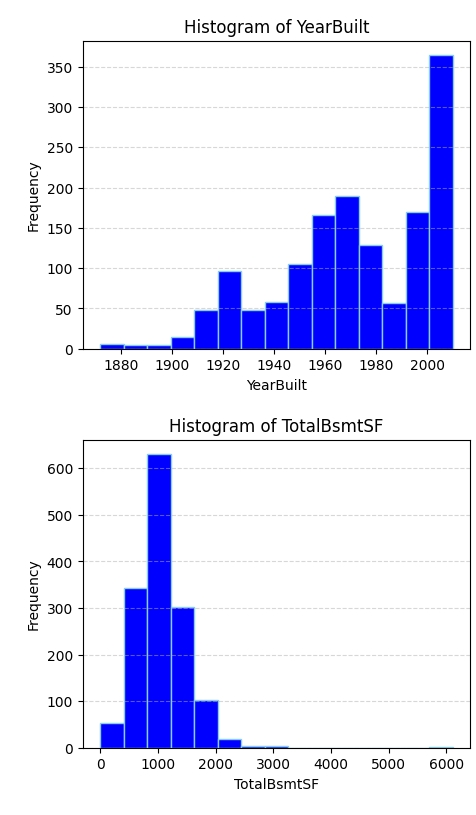
Distribution: For each of the 5 features, generate a histogram. Choose the number of bins properly.
import matplotlib.pyplot as plt

selected_columns = ['OverallQual', 'YearBuilt', 'TotalBsmtSF', 'GrLivArea', 'SalePrice']

for column in selected_columns:
    plt.figure(figsize=(5, 4))
    plt.hist(df[column], bins=15, color='blue', edgecolor='skyblue')
    plt.title(f'Histogram of {column}')
    plt.xlabel(column)
    plt.ylabel('Frequency')
    plt.grid(axis='y', linestyle='--', alpha=0.5)
plt.show()Scatter Plots of Key Features vs. SalePrice:
selected_features = ['OverallQual', 'YearBuilt', 'TotalBsmtSF', 'GrLivArea']
target_feature = 'SalePrice'
correlation_matrix = data.corr()

for feature in selected_features:
    plt.figure(figsize=(4, 3))
    plt.scatter(df[feature], df[target_feature], alpha=0.7, color='skyblue')
    plt.title(f'Scatter Plot of {feature} vs. {target_feature}')
    plt.xlabel(feature)
    plt.ylabel(target_feature)
    plt.grid(True, linestyle='--', alpha=0.7)
plt.show()Correlation:
selected_features = ['OverallQual', 'YearBuilt', 'TotalBsmtSF', 'GrLivArea']
target_feature = 'SalePrice'

correlations = df[selected_features + [target_feature]].corr()
print(correlations)
3.Feature Engineering:
Created new features such as TotalArea (sum of basement area and ground living area) and AreaPerRoom (average room size).
4. Modeling:
Implemented the K-Nearest Neighbors (KNN) algorithm to estimate housing prices.
Predicted the price of a new house (test dataset) by comparing it to 5 similar houses based on Euclidean distance.
3. Results:
Predicted price for the target house was $121,080.
Used the average price of the 5 nearest neighbors to generate the prediction.
Prices of the 5 nearest neighbors: $122,000 $125,500 $109,900 $109,500 $138,500
git clone https://github.com/gksdusql94/ML_House.git- Python 3.x
- Libraries:
- Pandas
- NumPy
- Matplotlib
- scikit-learn
This project demonstrates how to use machine learning techniques like K-Nearest Neighbors for regression tasks such as predicting housing prices. The preprocessing and feature engineering steps are crucial for improving model performance, and this project can be further extended by experimenting with more advanced algorithms like XGBoost or Random Forest.
Developed a machine learning model to predict hospital readmission likelihood, aiming to improve hospital operational efficiency and patient care management.
- Developed and deployed a machine learning model to predict hospital readmission, achieving an AUC score of 0.68 on the final test dataset.
- Preprocessed and cleaned a real-world dataset of over 8,000 hospital entries and 40 features (e.g., diagnoses, prescriptions, ER visits).
- Implemented Logistic Regression and XGBoost models with hyperparameter tuning, increasing predictive performance by ~7% using model stacking with TF-IDF for medical text data.


